- Cloudflare Traces, in open beta, records supported steps a request takes through Cloudflare and shows them in one timeline, including timing and outcomes.
- Coverage is partial, and new data-volume pricing starts December 1, 2026. Sampling choices will affect both visibility and cost once the new pricing starts December 1.
- Ask who sets sampling rates, whether your tools accept OTLP data, what an agent may read, and put the December pricing into next year's forecast.
The decisions you could not see
Many companies put a network provider in front of their website. That provider blocks, rewrites, caches and routes requests before the application ever sees them. Until now, answering what happened to one customer's request often meant reconstructing it from separate logs and configuration.
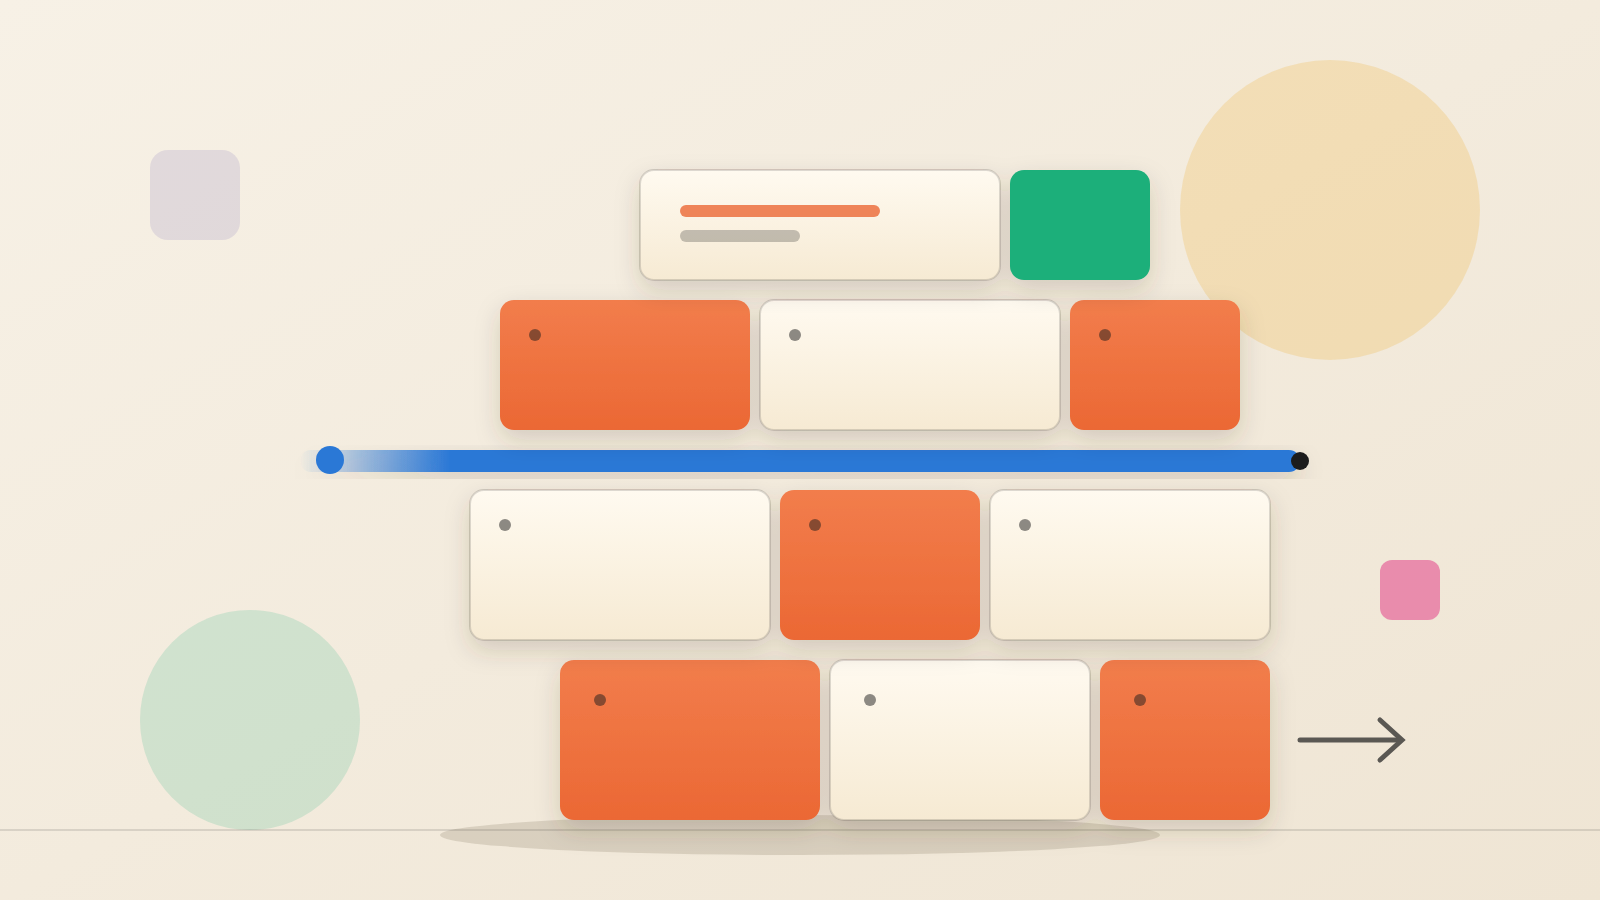
Cloudflare has now announced Cloudflare Traces, in open beta. The idea is simple. Every supported step a request takes through Cloudflare's platform is recorded and shown in one timeline.
The lesson here is that the layer in front of your application makes decisions about your customers. A decision you cannot inspect is hard to audit, hard to fix and hard to explain. Tracing turns those decisions into records.
How it works
Cloudflare calls each recorded step a span. A span holds its timing, its outcome and relevant details. Cloudflare says teams can see when security rules evaluated a request, how long that took and what action followed. They can also identify the rule behind a block or challenge.
Other spans cover URL rewrites and routing. The http_request_transform span lists each change, the part of the request it touched and the rule responsible. Routing has its own span, workers_routing. It tells you whether any route applied, what kind of routing was used and which pattern caught the request.
Cache and origin spans show where time went. In Cloudflare's example, a cache miss went to the origin. The origin spent 527ms of the 539ms response time. The slow part was the application behind Cloudflare, not the network in front of it.
Following a request past Cloudflare
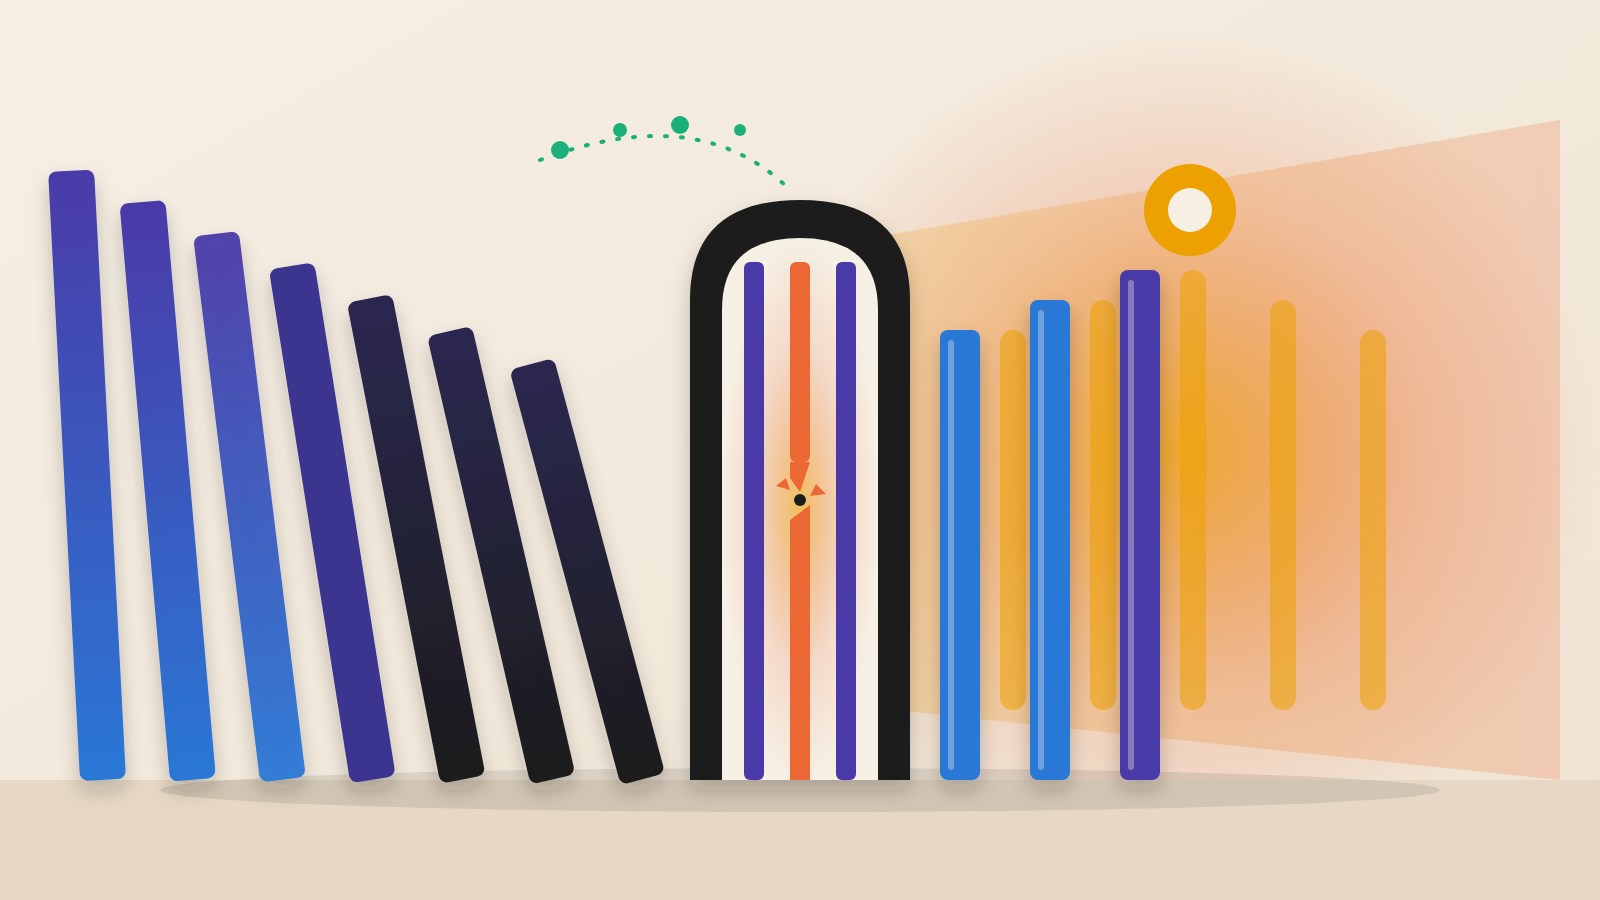
A trace is more useful if it does not stop at the edge. Cloudflare Traces can read an incoming traceparent header. That is a W3C standard way of passing a trace's ID from one system to the next. With it, Cloudflare's spans can attach to a trace that started upstream. A policy controls whether Cloudflare accepts that context.
The handoff also works in the other direction. Cloudflare can pass a fresh traceparent header on to your origin server. Instrumented applications, APIs and databases can read it and add their own spans to the same trace. Cloudflare sends its spans out over OTLP, the OpenTelemetry delivery protocol. To see one connected trace, Cloudflare's spans and your application's spans must go to the same compatible tool.
Cloudflare says no special instrumentation or plugins are needed once tracing is on for a domain. Teams choose how much to capture. A baseline sampling rate, for example 1% of requests, gives a steady view. Trace Rules can raise that to 100% for one hostname, source IP or debug header during an investigation.
The new cost is data volume
The pricing change matters to anyone signing the bill. Cloudflare says Traces will join its unified Observability pricing. Charges depend on how much data you ingest and how long you keep it, not on the number of spans. The new pricing applies to Cloudflare Tracing and Workers Tracing from December 1, 2026.
Storage is listed at $0.10 per GB-month. The pricing table also shows two quantities per billing cycle: 50 GB for ingestion and 10 GB-month for storage. Confirm in Cloudflare's pricing documents how those quantities apply to your plan.
Sampling is therefore a budget decision as well as a technical one. A 1% baseline with targeted 100% captures is the pattern Cloudflare describes for balancing visibility, volume and cost.
Agents, and what is not covered yet
Cloudflare also describes letting a coding agent query traces through its Observability MCP server. The agent can compare failed traces with successful ones and find where their spans diverge. It can then connect that to code in your repository and help prepare a fix for a person to review.
That raises a governance question. Production telemetry now becomes something an automated tool can read. The post does not say what data traces contain beyond spans, timings, outcomes and attributes. Teams should check what that includes for them.
Coverage is also partial. The post says Traces records supported steps. Spans for DDoS rules and Access are on Cloudflare's list of planned additions. So is authenticated context propagation, which would let trusted callers continue a trace without the platform accepting context from every incoming request. Today's trace is useful, but it is not yet the whole path.
What to ask your team
First, ask which questions cost you the most hours. Why was a customer blocked? Was a URL rewritten before it reached the app? Where did the time go? These are the questions Cloudflare says traces answer.
Second, ask who sets the sampling rate and who may switch on full capture for one customer. Third, ask whether your tracing tool can receive OTLP data, so edge and application spans sit in one view.
Fourth, put the December 1 pricing into next year's forecast. Fifth, decide what an agent may read before connecting one to production data.
Cloudflare's own teams, it says, rely on internal traces to investigate. Customers are now being offered a version of that view. The measure of its worth is how quickly your team can explain one blocked request.
Produced by the WebPulse Newsroom with AI assistance from the original reporting credited below, and checked against that source by our editorial review. How we use AI.
Original reporting: Cloudflare.